Methodology

Table of Contents
Introduction
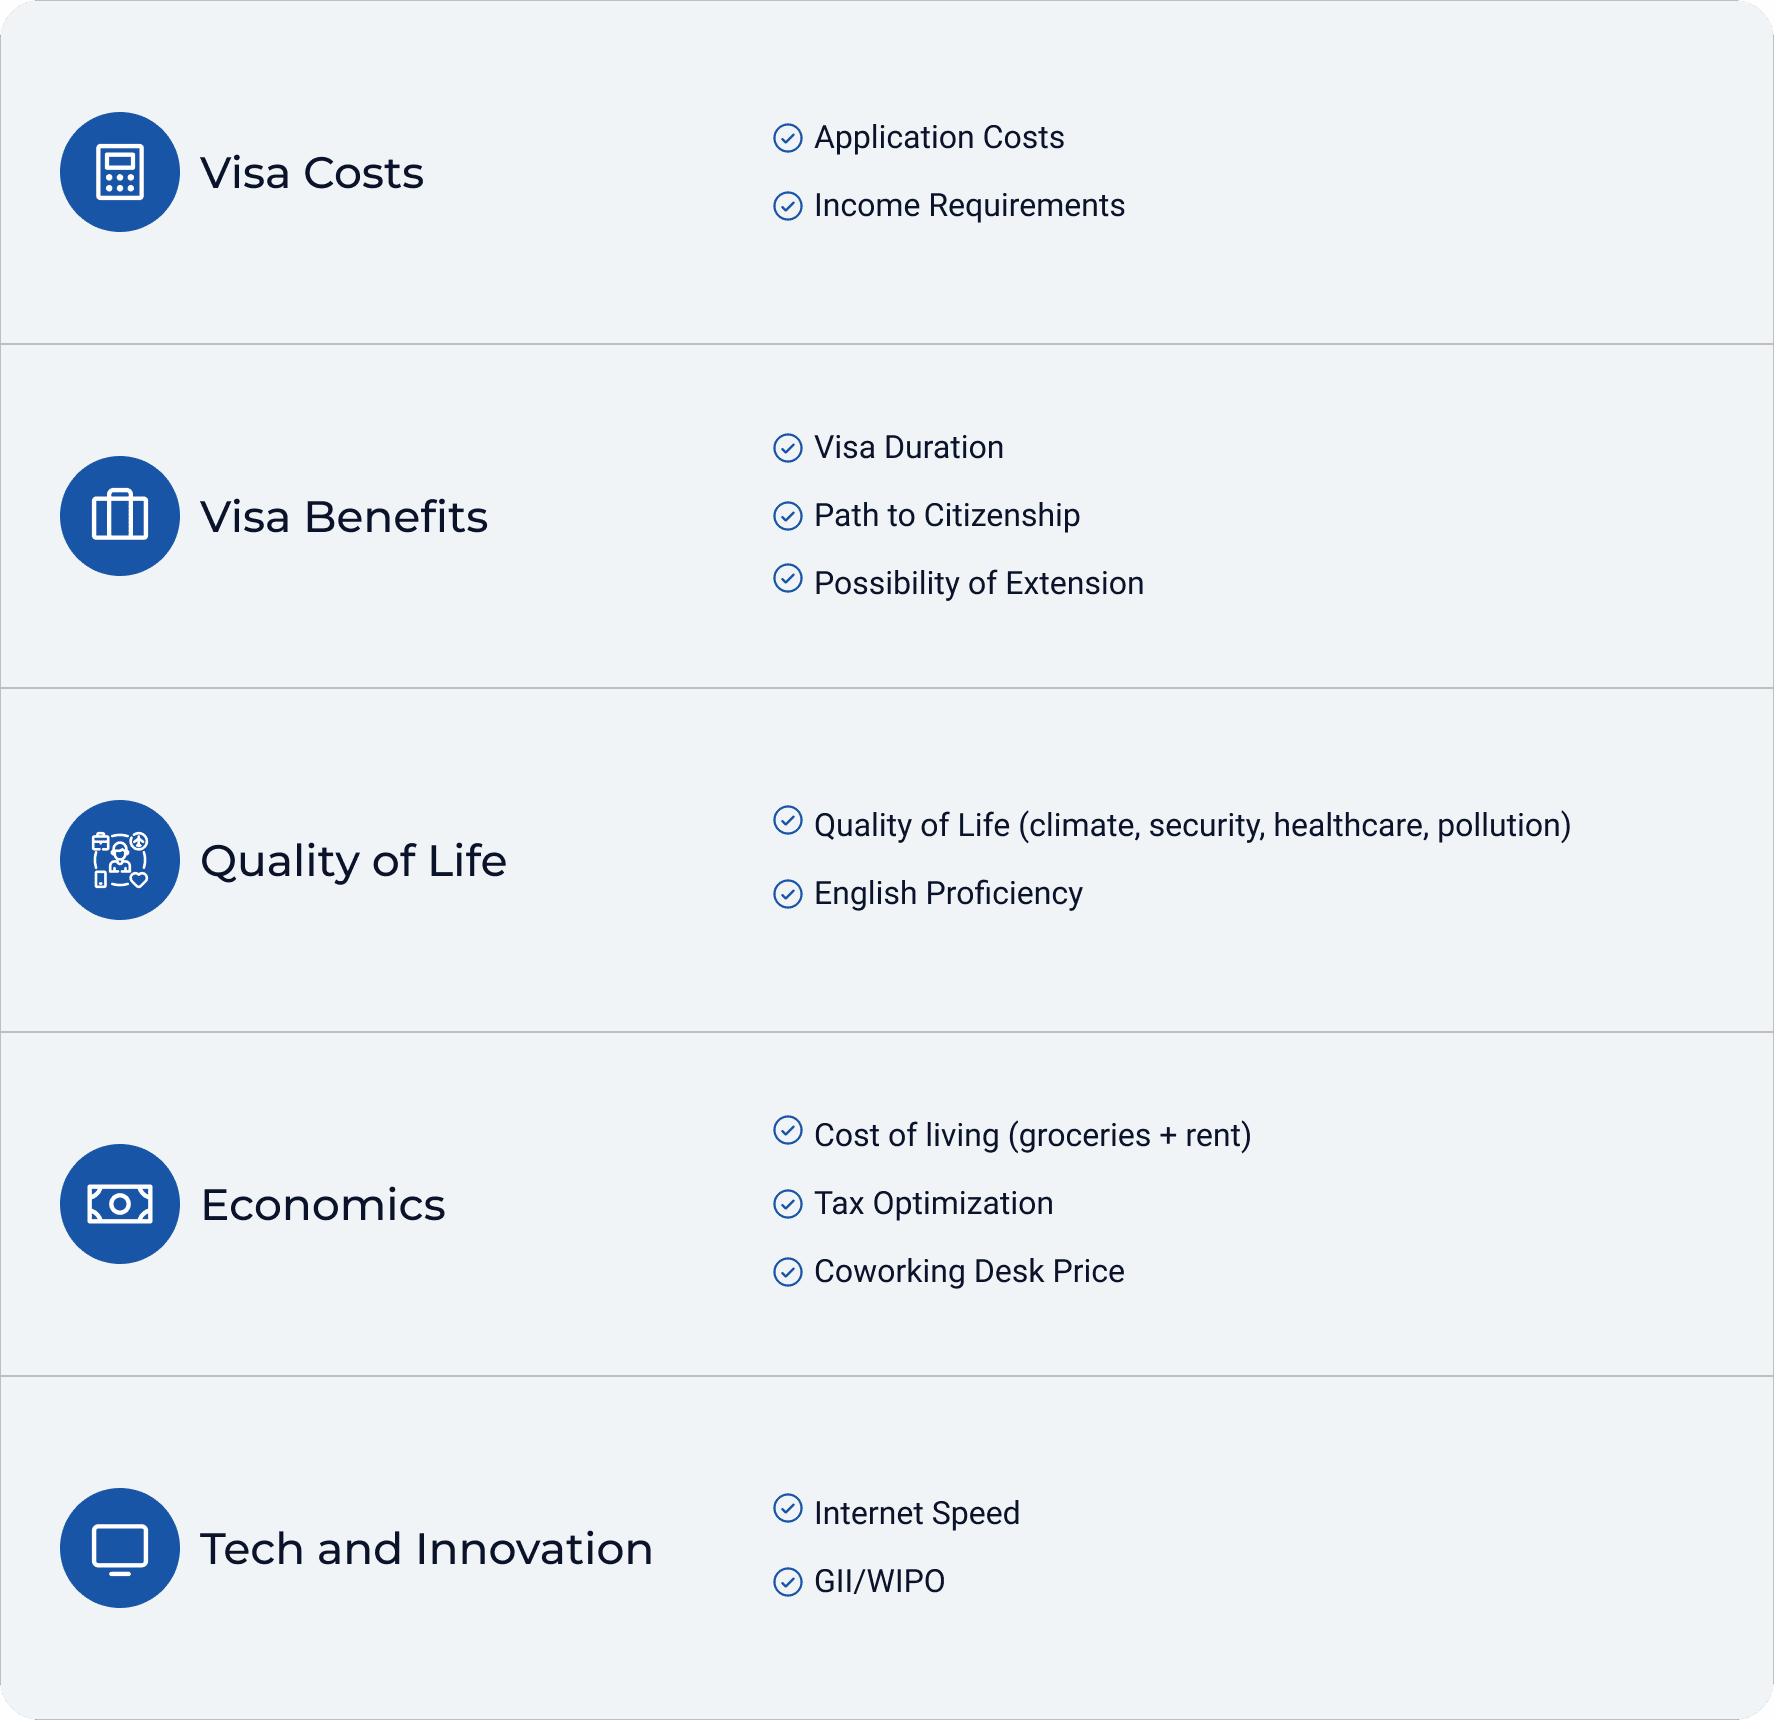
The Global Citizen Solutions Digital Nomad Index is composed of 12 target-oriented indicators grouped into 5 thematic sub-indices.
Data was gathered from reliable sources, such as Numbeo for Cost of Living and Quality of Life, the English Proficiency Index, Hot Desk Price Index for coworking desk price, Speedtest Global Index for internet speed and Technology Innovation from GII/WIPO. Each of these indicators was selected to provide a comprehensive overview of factors important to digital nomads according to research and surveys.
For the tax optimization indicator, we selected the higher range tax percentage and normalized the data on a “lower is better” basis. A similar approach was applied to the visa application costs and income requirement indicators. In the visa benefits subsection, higher values were assigned to visas offering a longer duration. For the path to citizenship, we assigned the highest score to countries providing direct access to citizenship from the nomad visa, a medium score to countries offering a path to permanent residence, and a zero to countries with no access to permanent residence. Countries offering the possibility of visa extension received a score of one, while those not offering this possibility received a zero.
To ensure comparability across all data points, each was normalized using the Min-Max Normalization formula, rescaling the range of features to scale within [0, 1]. This normalization process ensures that all indicators contribute equally to the final index, providing a balanced and fair comparison across different jurisdictions. This structured and systematic approach allows the Global Citizen Solutions Digital Nomad Index to offer a comprehensive evaluation of the best jurisdictions for digital nomads, reflecting various aspects crucial for a nomadic lifestyle.
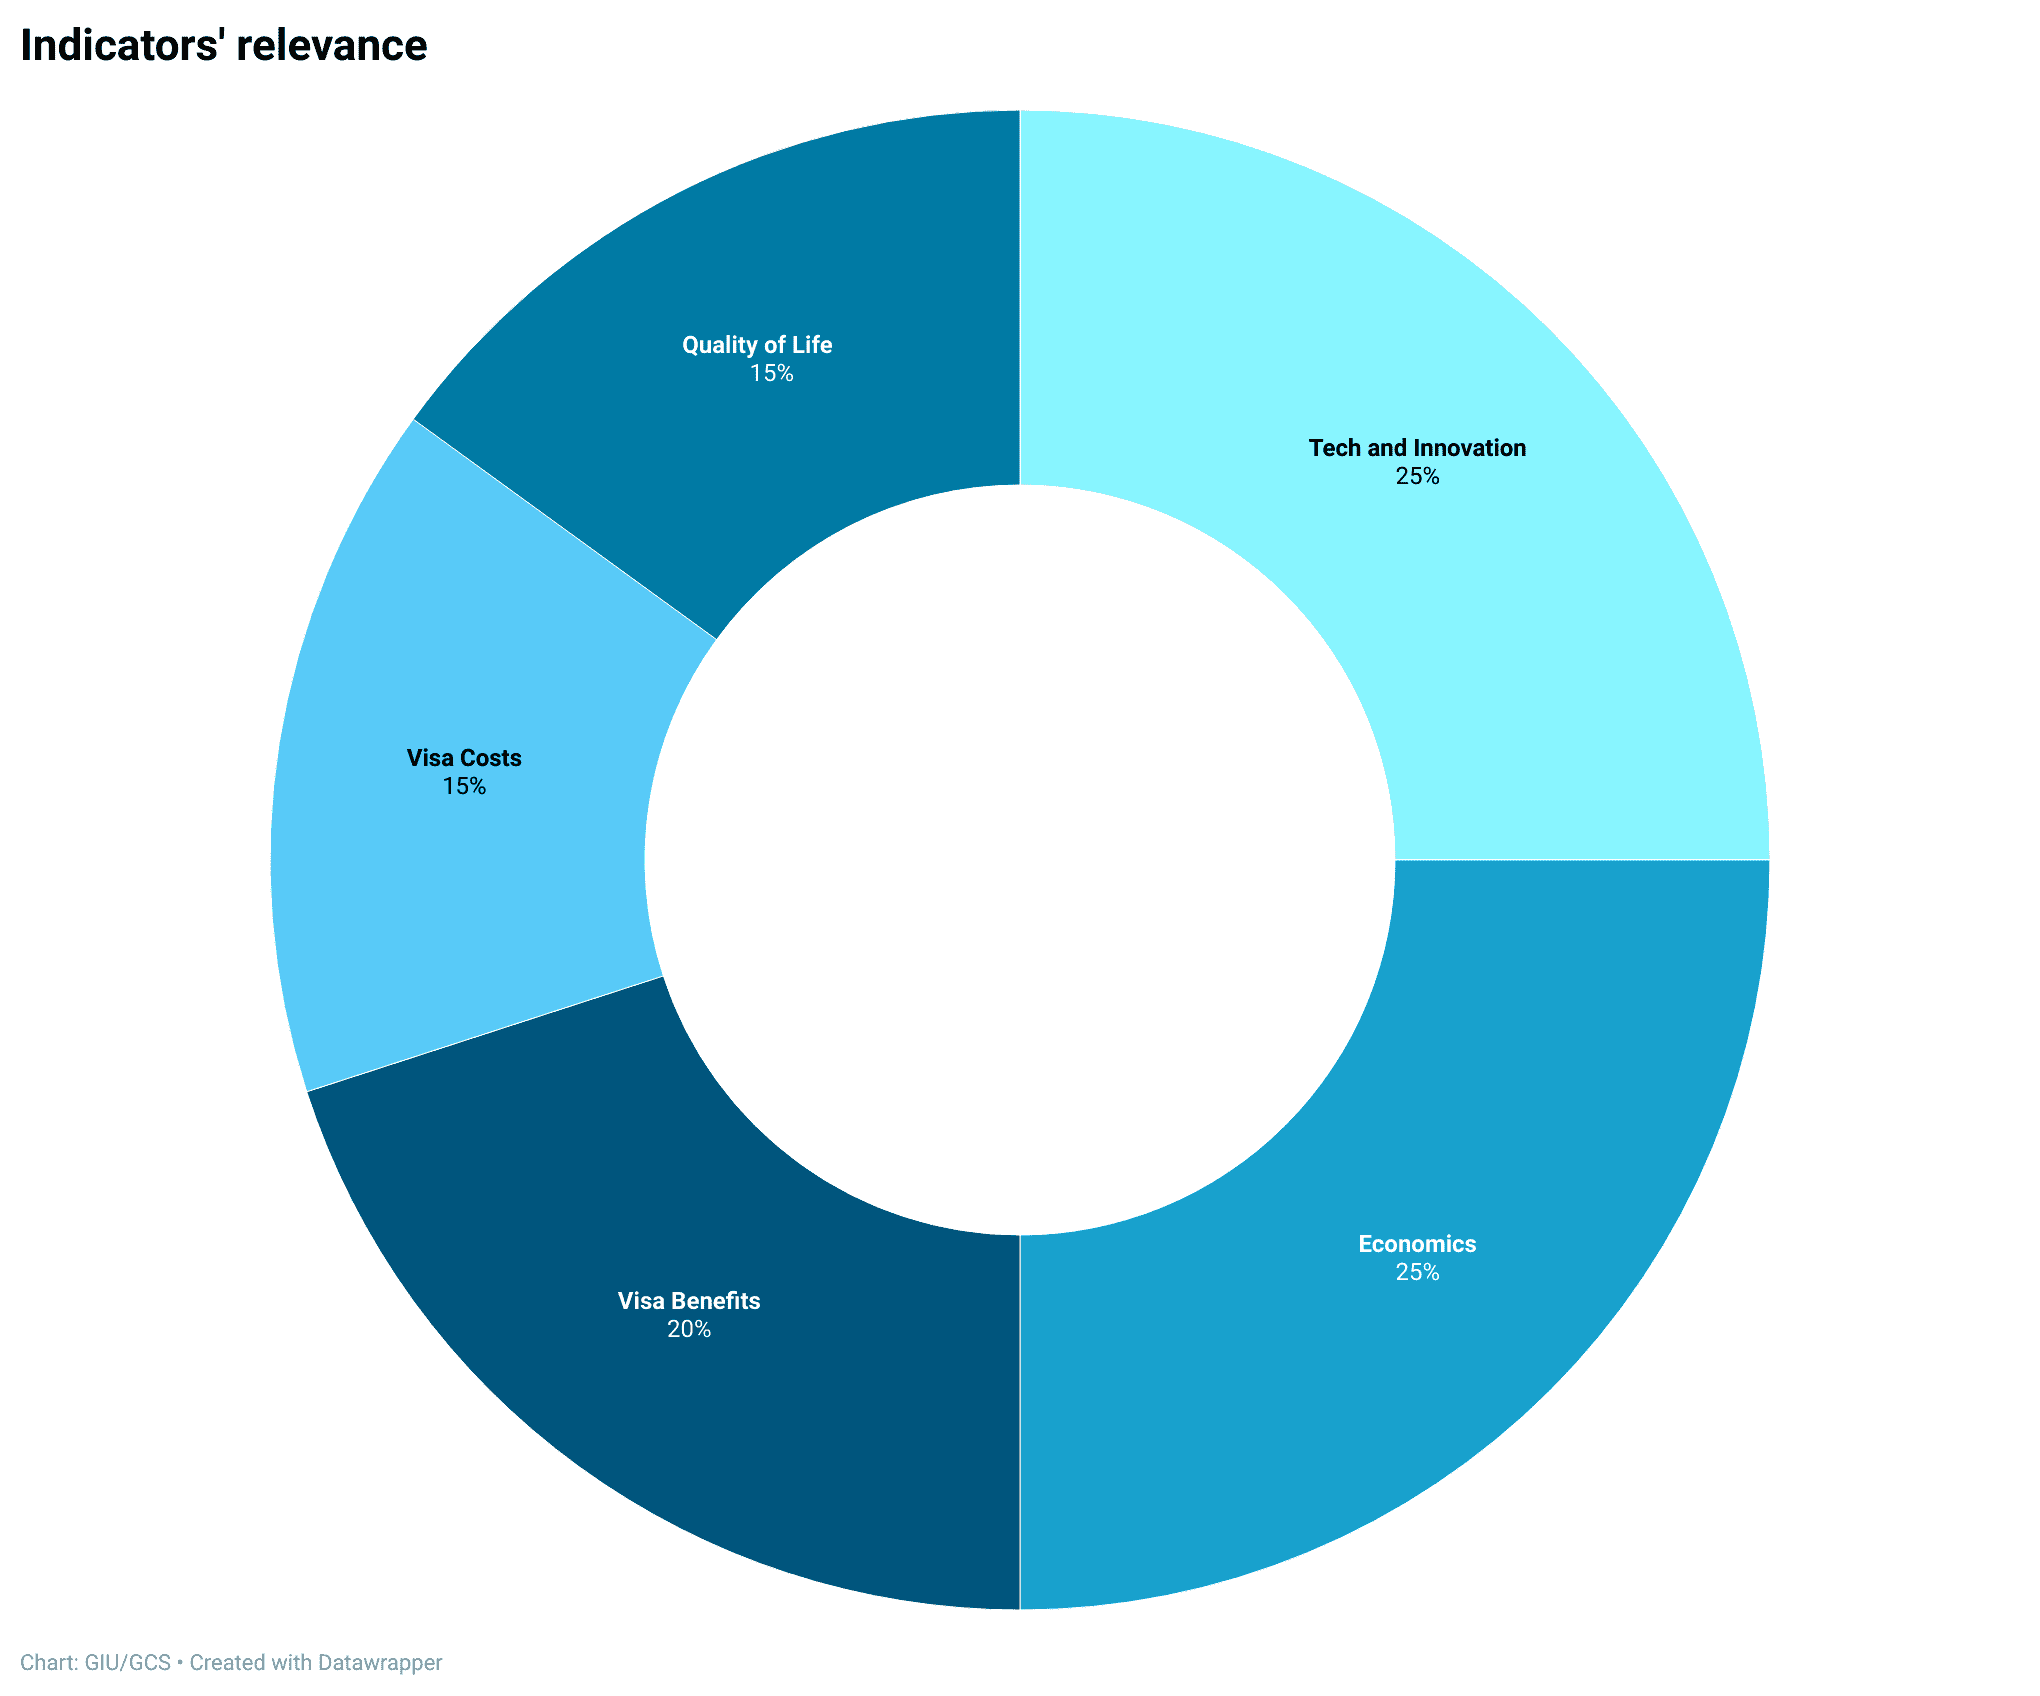
Weights were assigned to each indicator based on its relevance and impact on the decision-making process of digital nomads. These weights were determined using publicly available data, as well as research on the needs and preferences of nomads, gathered from academic papers and insights from industry experts.
Analysis of Indicators
Visa Costs
Visa costs indicator encompass the fees associated with visa applications for digital nomad visas and similar arrangements, as well as the annual income requirements for applicants. This data was gathered from publicly available information retrieved from official government websites and secondary sources. To ensure comparability, the data was normalized using a “lower is better” approach, meaning that countries with lower costs and income requirements received higher scores.
Countries with the highest scores, indicating the most affordable visa costs and income requirements, were ranked at the top of this sub-ranking. This approach provides a clear and standardized comparison of the financial barriers to obtaining digital nomad visas across different countries.
Visa Benefits
The visa benefits indicator is a composite measure that considers visa duration, path to citizenship, and possibility of extension. Higher scores were assigned to programs with longer durations, those that offer a direct path to citizenship, and those that can be extended within the same application process. Scores were assigned on a scale from 0 to 1, with higher scores indicating more favorable conditions.
For visa duration, programs range, in general, from 3 months to 3 years, and those with longer durations received higher scores. Regarding the path to citizenship, we identified three types of programs: those offering direct access to citizenship through a digital nomad visa, those providing access to permanent residency that can lead to citizenship, and those that do not permit using the nomad visa framework for citizenship. Countries offering direct access to citizenship were given the highest scores, reflecting the significant benefit of immediate citizenship eligibility. Similarly, countries allowing visa extensions scored higher than those without this option.
The data for this analysis was collected from publicly available information, primarily from official government websites and secondary sources. To ensure comparability, the data was normalized using a “lower is better” approach, meaning countries with more favorable visa benefits received higher scores and were placed at the top of this sub-ranking. This method provides a clear and standardized comparison of the benefits associated with digital nomad visas across different countries.
Quality of Life
The quality of life indicator is a composite measure comprising two sub-indicators: quality of life and English proficiency. The quality of life data was sourced from Numbeo1Numbeo. (2024). Quality of Life Index by Country. Retrieved from https://www.numbeo.com/quality-of-life/rankings_by_country.jsp, which uses a comprehensive formula to calculate its index. This formula incorporates various factors such as purchasing power, house price-to-income ratio, safety, healthcare, traffic time, pollution, and climate. Scores were assigned on a scale from 0 to 1, with higher scores indicating more favorable conditions.
For English proficiency, the data was obtained from the EF English Proficiency Index2. This index assesses the average level of English skills in each country. Similar to the quality of life scores, English proficiency scores were also assigned on a scale from 0 to 1, with higher scores representing better proficiency. Both sub-indicators were crucial in determining the overall quality of life for digital nomads considering different countries.
The data for this analysis was collected from publicly available information, primarily from official government websites and secondary sources. To ensure comparability, the data was normalized using a “higher is better” approach, meaning countries with higher scores were placed at the top of this sub-ranking. This method provides a clear and standardized comparison of the quality of life and English proficiency across different countries, helping digital nomads make informed decisions.
Economics
For the economic indicators, we utilizedsed three primary sources: the Cost of Living Index from Numbeo2Numbeo. (2024). Cost of Living Rankings by Country. Retrieved from https://www.numbeo.com/cost-of-living/rankings.jsp and the Coworking Desk Price Index from Hot Desk Price Index3Coworking Insights. (2022). 2022 Hot Desk Price Index. Retrieved from https://coworkinginsights.com/wp-content/uploads/2022/05/2022-Hot-Desk-Price-Index-1.pdf. Regarding tax optimization, we normalized highestthe highest tax rates for each of the 65 countries in the index.
The Cost of Living Index provides a comprehensive overview of the general expenses associated with living in different countries, including housing, groceries, transportation, and other essential costs. The Coworking Desk Price Index offers data on the average cost of renting a coworking space, which is a crucial factor for digital nomads who often rely on such facilities for their work. To assess tax optimization, we normalized the highest tax rates in each country to provide a clear comparison of tax burdens. Each of these indicators was assigned a score ranging from 0 to 1, with higher scores indicating more favorable economic conditions.
This data was collected from publicly available information and was standardized (“lower is better”) to ensure comparability across different countries. By normalizing the data and using a consistent scoring system, we were able to create a clear and concise sub-ranking of economic indicators.
Tech and Innovation
For the tech and innovation sub-index, we utilizedsed the Internet Speed Index from Ookla Speedtest4World Intellectual Property Organization. (2023). Global Innovation Index 2023. Retrieved from https://www.wipo.int/global_innovation_index/en/ and the Global Innovation Index (GII) from the World Intellectual Property Organization (WIPO)5Ookla. (2023). Speedtest Global Index. Retrieved from https://www.speedtest.net/global-index. Ookla Speedtest is renowned for accurately testing the performance and quality of internet connections. It measures various factors impacting connectivity, such as bandwidth, latency, coverage, and video metrics.
The Global Innovation Index (GII) from WIPO offers a comprehensive assessment of innovation across approximately 132 economies. It uses around 80 indicators to evaluate the political environment, education, infrastructure, and knowledge creation. The GII highlights the innovation strengths and weaknesses of different economies, allowing for performance monitoring and benchmarking against regional and income group peers. This index is particularly valuable for understanding the broader innovation landscape in each country.
Scores for both the Internet Speed Index and GII were assigned on a scale from 0 to 1, with higher scores indicating more favorable conditions. The data for this analysis was collected from publicly available sources, primarily official government websites and secondary data. To ensure comparability, the data was normalized using a “higher is better” approach. This method ensures that countries with superior tech and innovation environments received higher scores, providing a clear and standardized comparison for evaluating digital nomad visa benefits across different countries.