Global Education Report: Methodology

Table of Contents
Introduction
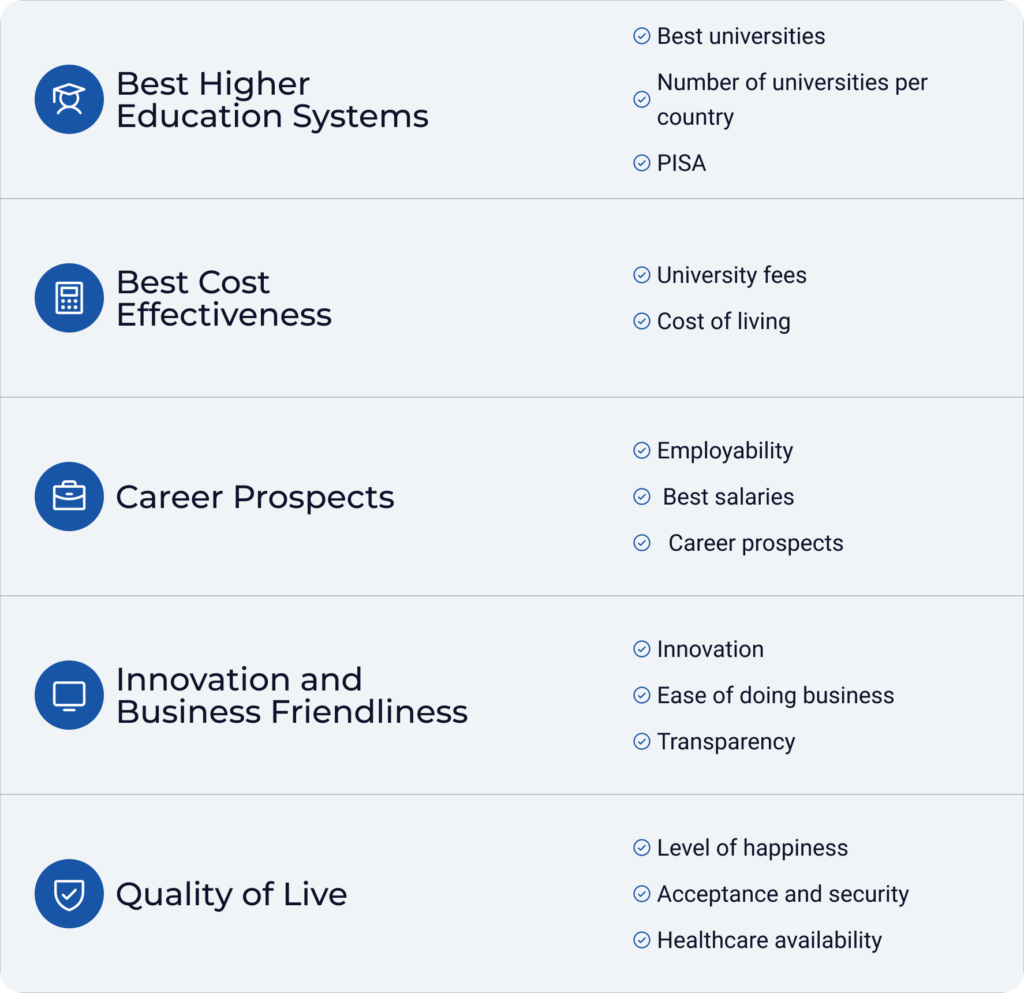
The Global Citizen Solutions Education Report comprises 14 targeted indicators organized into 5 thematic sub-indices.
To ensure comparability across all data points, each was normalized using the Min-Max Normalization formula, rescaling the range of features to scale within [0, 1]. This normalization process ensures that all indicators contribute equally to the final index, providing a balanced and fair comparison across different jurisdictions. This structured and systematic approach allows the Global Education Index to offer a comprehensive evaluation of the best locales for international students to relocate for higher education, reflecting various aspects of their lifestyle.
Weights were assigned to each indicator based on its relevance and impact on the decision-making process of students and their families. These weights were determined using publicly available data, as well as research on the needs and preferences of students, gathered from academic papers and insights from industry experts.
Analysis of Indices
Best Education Systems
For the Education Systems sub-index, we gathered data from the Time High Education Report, focusing on the top 1,000 universities globally and their respective scores. Countries were then ranked based on the number and scores of their top universities, providing insight into educational excellence within each nation. Additionally, we incorporated PISA (Program for International Student Assessment) rankings to reflect secondary education quality across countries. This approach allowed the sub-index to capture both the presence of leading higher education institutions and the performance of each country’s broader educational framework.
Education Cost Effectiveness
The construction of higher education cost-effectiveness indicators involved a rigorous analytical approach, leveraging the Numbeo Cost of Living Index to capture a range of expenses, including housing, healthcare, energy, groceries, and dining costs, alongside purchasing power parity data. This dataset provided a foundation for evaluating the affordability and financial demands faced by students in each country. To refine the analysis, we incorporated average university tuition fees from both public and private institutions, ensuring a holistic representation of educational costs. The integration of living expenses and tuition fees enabled the calculation of a cost-effectiveness ratio, which measures the balance between the quality of higher education and its associated financial burden. To sharpen the results, we applied a weighted scoring system that prioritized countries with robust higher education systems, as determined by global rankings and institutional performance metrics, while penalizing nations where education is disproportionately expensive compared to quality. This approach ensured that the indicators not only reflect affordability but also reward countries that deliver high-value education at reasonable costs, thereby providing a well-rounded and fair assessment of higher education accessibility and financial sustainability across regions.
Career Prospects
To build the Career Prospects sub-index of our Global Education Index, we integrated several indicators that reflect the career and economic prospects for graduates in each country. We collected data on employability from the CIA World Factbook, focusing on national unemployment rates, which provide insight into job market stability and the ease of finding employment post-graduation. Salary benchmarks from the CEO World Index were also included, highlighting the earning potential for graduates and signalling the financial returns of higher education. Additionally, we considered the number of CEOs and top executives who studied at universities in each country according to the 2022 University Alumni Report from Altrata, which serves as a measure of alumni influence and career advancement potential. This metric offers insight into the capacity of a country’s universities to produce leaders and connect graduates with influential professional networks. Collectively, these indicators provide a deep overview of the work conditions and career outcomes associated with each nation’s educational system, enhancing our understanding of the long-term value that education offers.
Innovation and Business Friendliness
To build the Innovation and Business Friendliness sub-index within the Global Education Index, we incorporated data from three indicators: the Tech and Innovation Index from the Global Innovation Index (GII) and the World Intellectual Property Organization (WIPO), the Transparency Index from Transparency International, and the Ease of Doing Business rankings from Doing Business.org. The Tech and Innovation Index provides insight into a country’s capacity for technological advancement and innovation, both of which are essential for fostering a competitive and modern educational environment that prepares students for emerging industries. The Transparency Index reflects the level of integrity and openness in government and business practices, a key factor that influences both investment and trust in a country’s institutions. Finally, the Ease of Doing Business ranking evaluates regulatory efficiency and business-friendly policies, offering a perspective on how conducive a country’s environment is for entrepreneurial and economic activity. Together, these indicators give a powerful overview of the innovation ecosystem and business climate, highlighting how well countries support technological advancement, transparency, and ease of operation for businesses and educational institutions alike.
Quality of Life
The Quality of Life Index in our Global Education Index includes several crucial indicators: Quality of Life from Numbeo, Migrant Acceptance from Gallup, Healthcare, the Peace Index from the Global Peace Index, and Happiness from the World Happiness Report. These indicators are vital for international students when selecting a country to study and live in. The Quality of Life rating provides a broad overview of living conditions, covering factors such as cost of living, pollution, and climate, which affect daily life. Migrant Acceptance measures societal openness to foreigners, indicating how welcoming and inclusive a country is—important for international students looking to integrate smoothly. Healthcare is essential for assessing the accessibility and quality of medical services, ensuring students can maintain their well-being abroad. The Peace Index offers insight into a country’s safety, which is a priority for students moving to unfamiliar environments. Lastly, the Happiness Index reflects overall life satisfaction and well-being, contributing to a positive and fulfilling international study experience. Together, these indicators offer a holistic view of each country’s liveability, safety, and inclusivity, helping students make informed decisions about their educational and lifestyle choices abroad.